To cope with the significant increase for storage and on-demand delivery of digital content, enterprises need to boost their optical-pipe capacity. Most turn to coarse wavelength-division multiplexing (CWDM) and dense wavelength-division multiplexing (DWDM) to scale up and avoid installing new fiber. Whether they are planning to lease this extra capacity or use it themselves, someone has to deal with maintenance. One may ask: “Can’t I just go on maintaining my new optical network as I did before?”
CWDM, by design, is a mid-range technology perceived as a cost-wise, first step toward the use of DWDM which, to some extent, can then be deployed over CWDM optical filters. CWDM also favors connectivity in a multiple-operator, multiple-network environment, where using only one fiber on a specific trunk (instead of two) can make the difference in establishing connectivity between two sites at an affordable cost—and not only in terms of fiber utilization cost, but also in terms of operation and maintenance. However, using fewer fibers, or increasing traffic on existing ones, also increases the importance of maintaining their availability at all times. “How can I simultaneously deploy traffic, while testing and monitoring the fibers I lease, if I decide to transmit CWDM signals?” is a question we’ll answer in this article.
OTDR for Network Support and Maintenance Activities
An optical time-domain-reflectometer (OTDR) is a well-known and efficient tool for monitoring and troubleshooting optical fibers in cabled optical networks. OTDR surpasses most other techniques as it enables:
Single-ended, one-operator measurement of the fiber and splice quality
Distributed testing along the cable sheath length—with proper configuration, a fiber fault can be located and positioned with respect to the OTDR launch position
With a fiber fault at a given location along the cable sheath length, one can further investigate the “what” when combined to a network inventory management system. If the cable span tested is documented and mapped using GIS technology, then it is the “where” which can be added to the fault analysis process. Although this process is described in simple terms, outside-plant documentation that is digitized with high resolution, up-to-date and detailed down to fiber level is essential to benefit fully from the raw information captured by an OTDR.
Fault position with respect to total cable
Figure 1. Fault position with respect to total cable length on the OTDR unit can be transposed to fault geographical location with respect to the piece of the network, cable or splice joint impacted; an in-service, fiber-monitoring solution enables this correlation to take place automatically in fibers carrying traffic.
Once a network is in operation, one can permanently place an OTDR in a rackmount unit at a centralized location of the network, hub or central office (CO), which can be shared among the network support staff who can, at any time, remotely access the unit, select a specific fiber strand and test it. The OTDR instrument can also be programmed to routinely test some critical fibers, for early detection of degradation that may impair the signals transmitting into those same fibers. This is the main use of EXFO NQMSfiber fiber testing and monitoring solution.
Performing CWDM Live-Fiber Testing
After passive CWDM optical filters are installed, and circuits lighted-up with one or multiple CWDM wavelengths, the first servicing task one might need to perform is a simple OTDR test on one, or multiple, sections of a cable linking two facilities without interrupting traffic; this is also called in-service testing. To perform CWDM live-fiber testing, three methods are possible:
Out-of-band, using an additional WDM to MUX the U-band (1650) test wavelength to the line
In-band, using one of the CWDM channels as test wavelength
Test through tap or monitor port of CWDM optics—when available
Out-of-Band 1650 nm OTDR Testing
Out-of-band testing for coarse wavelength-division multiplexing (CWDM) requires the use of a 1650 nm optical time-domain reflectometer (OTDR) instead of 1625 nm because the last CWDM channel at 1611 nm is too close to 1625 nm, which is traditionally used for live fiber testing of 1310/1550 nm circuits. For this, a three-port wavelength-division multiplexer (WDM) needs to be added on the line to inject the OTDR signal to the fiber carrying CWDM channels. If it is not inserted prior to CWDM commissioning, it will not be possible to test live without interrupting traffic – interruption to last long enough for device connection and test. Out-of-band testing adds a minimum of 1 dB penalty to the link budget, which needs to be taken into account at the circuit design stage. In cases where multiple sections need to be tested from a central site in one acquisition, then by-pass site(s) using DEMUX/MUX functions have to be planned, which increases link attenuation to another 1 dB.
Out-of-band OTDR testing at 1650 nm of CWDM links
Figure 1. Out-of-band OTDR testing at 1650 nm of CWDM links
By-passing a node for testing end-to-end
Figure 2 By-passing a node for testing end-to-end.
At the end of the line, the 1650 nm test wavelength is usually rejected by the CWDM filter. Care must be taken to ensure that the CWDM filter at the end of the path is at least 30 to 35 dB isolation at 1650 nm. If not, the same WDM filter used for injection and by-pass can be installed at the end of line and act as a rejection filter for 1650 nm.
Testing out-of-band at 1650 nm has the advantage of quickly revealing unwanted bending of the cable or the individual fiber strand, as this wavelength propagates in the outer diameter of the fiber core. The difference in fiber attenuation between 1650 nm from 1550 nm is not larger than the difference between 1310 nm and 1550 nm. In most fibers seen and available today, the fiber attenuation at 1650 nm is about 0.25 dB/km (typically) compared to 0.2 dB for 1550 nm. For a 60 km link tested at 1650 nm, this is within 3 dB from what would be measured at 1550 nm on a fiber that has no excessive bending. It is therefore recommended to have a construction trace at 1625 nm, if possible at 1650 nm, in order to record the difference of the attenuation measured at both wavelengths for consistency in the measurement taken before and after the fiber goes live. Obviously, the implementation of a 1650 nm testing path throughout the network can, in some cases, be troublesome and adds costs and complexity, which is not always welcome.
In-Band Use of a CWDM Channel for OTDR Testing
The in-band method uses one or multiple CWDM channels for OTDR testing. This is a straight connection of a CWDM-enabled OTDR into the MUX/DEMUX CWDM filter used for transmission.
In-band OTDR testing using one unused CWDM channel
Figure 3. In-band OTDR testing using one unused CWDM channel.
Despite the fact that one channel becomes ‘dedicated’ to testing, in-band is a test method that can be implemented after the network has been commissioned, which is a great advantage compared to the out-of-band approach. It is also simple to establish a test route. When passive add/drops are used over a ring, the selected test channel will continue and follow the other express channels. When all channels terminate in a site and are regenerated for another section, it simply requires patching between the same channel ports on both sides of the route. Either the transmit or the receive port can be used.
In-band OTDR testing using 1470 nm
Figure 4. In-band OTDR testing using 1470 nm. For establishing end-to-end test, route patching is done in intermediate sites between 1470 nm ports of the CWDM MUX/DEMUX. Only one fiber, either transmit or receive is presented here. For fiber pair communication, two test ports of the test equipment have to be used.
It is interesting to note that service channel (SC), or expansion channel (EC) at 1310 nm or any other wavelength, if available and not in use, can also be selected for in-band testing, similarly to above with less stringent requirements in terms of channel bandwidth for the tolerance on central OTDR wavelength.
Testing through Broadband Tap Coupler (Monitor Port) of CWDM Optics
Some CWDM MUX/DEMUX/ADM devices are equipped with taps (1 to 10%) in order to monitor traffic. These monitor ports are broadband couplers, and extract a portion of traffic usually for testing with protocol analyzers. When testing in opposite direction than traffic, the CWDM signal power, even though attenuated by the tap, will be detrimental to perform a proper OTDR measurement—unless one selects a filter to isolate the OTDR wavelength band from active CWDM channels.
Broadband tap coupler as a monitor port can be used for OTDR testing
Figure 5. Broadband tap coupler as a monitor port can be used for OTDR testing but care must be taken to isolate the OTDR test wavelength from active channels.
The isolation of the filter to place between the tap/monitor port and OTDR must be at least 50 to 60 dB when testing against traffic. It must be a band-pass type if the test wavelength is in-band. If the OTDR is out-of-band, a high-pass filter for 1650 nm can be used. For the case of in-band, one or two cascaded optical add/drop multiplexers (OADMs) can be used as band-pass filters. If the fiber transmits CWDM traffic at the same wavelength selected for testing, OTDR will fail measuring.
Limitations with this approach are:
Major drop (seen in literature up to 23 dB or less than 1%) in optical attenuation, cutting large amounts of the available OTDR measurement range; if the monitor port ratio was 10% (10 dB), it could be used
The test direction is likely always against traffic—at least in case of fiber pair transmission, which doubles the number of test units to install, one at each end. For single fiber bidirectional transmission, this limitation does not apply
Additional care must be taken to ensure proper isolation of the OTDR from attenuated but unfiltered CWDM channels
Practical Examples of In-Band Remote Testing and Proactive Monitoring
While out-of-band testing, which uses 1650 nm, is used more and more in coarse wavelength-division multiplexing (CWDM) networks, the in-band approach, which uses one dedicated CWDM channel, is not used very much, although it provides network maintenance teams with additional benefits such as:
Test path(s) can be established directly from the CWDM passive optics installed for transmission, if at least one channel is reserved for testing purposes;
The loss budget remains the same with or without testing capabilities added;
The attenuation measured at the test channel is the same or very close to the other channels, which reduces the difficulty to analyze if a degradation actually affects transmission;
Selecting lower wavelengths (e.g., 1470 nm) can reduce the effect of Raman noise compared to using 1625 or 1650 nm, although larger effective mode area fibers available today tend to reduce these non-linearities.
A network test setup is presented below (on a reduced scale), and includes a test unit located at a ring major hub. This can be extended to a larger network by multiplying this schema. Each fiber pair is tested from the central location using a 1470 nm channel. Provision for no point of failure can be added at the opposite side of the link, enabling bidirectional testing. Test units are connected over TCP/IP in a ring topology, this creates a no-point-of-failure testing topology. When using a different channel, such as 1490 nm, each fiber can be tested from both sides at the same time. It can also help diagnose and locate specific fiber degradation that could otherwise be missed or reported with lower precision, if tested from one side only.
CWDM simple network with OTDR monitoring on each live fiber: unidirectional or optional bidirectional on each strand.
Figure 1. CWDM simple network with OTDR monitoring on each live fiber: unidirectional or optional bidirectional on each strand.
In the above topology, each link extends up to 20 dB fiber attenuation, which is typically an attenuation that EXFO’s CWDM optical time-domain reflectometer (OTDR) can measure in total from one end, while detecting and locating small degradations. A single fiber carrying CWDM in both directions closes the two long east/west paths—this fiber can be tested with one additional unit since the hub test unit cannot measure well enough beyond the attenuation created by the fibers connected to it. Again, even for this fiber, surveillance and remote testing can be performed at 1470 nm or bidirectionally with 1470/1490 nm channels.
Assuming that each CWDM filter adds a 2.5 dB loss, this requires that an OTDR be able to measure up to at least 25 dB optical attenuation, in which we include the optical switch unit as well as the jumper(s) insertion loss. This can be achieved by using a 10 μs pulse on the OTDR and requires no more than an acquisition time of 15 seconds. The dynamic range, as per standard OTDR definition, is 40 dB for this module.
10 μs pulse width; 15-second OTDR acquisition on a live CWDM fiber with 20 dB attenuation
Figure 2. 10 μs pulse width; 15-second OTDR acquisition on a live CWDM fiber with 20 dB attenuation.
The above trace was taken with 10 dBm CWDM TX injection power in live-fiber conditions. The OTDR detects back-scattered signals but also detects the diffused or scattered power from the other signals, which cannot be totally eliminated using extra band-pass filters. Below, we compare the same link tested dark and live, as per above conditions (in red is the dark fiber):
Comparison between a dark (red) and live (black) fiber
Figure 3. Comparison between a dark (red) and live (black) fiber; live is 10 dBm injected power into the fiber being tested. Extra isolation was added around the OTDR channel for cases where transmitters are at the opposite side of the link or when an OTDR at opposite side is testing at same time
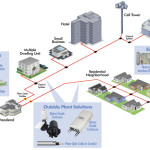
The figure below illustrates an implementation example of cable and fiber monitoring from central location to two remote premises connected optically from end to end. Here, we assume that the distances and attenuation are consistent with CWDM standards from the central to a remote location. The CWDM OTDR is used at 1470 nm; it monitors the two live fibers in the main loop in co- and counter-propagation and at the passive nodes, the OTDR signal from one of the fibers is re-directed to a maintenance dark fiber of the access line.
Implementation example in a CWDM all-optical network, connecting remote sites to central location with a redundant path
Figure 4. Implementation example in a CWDM all-optical network, connecting remote sites such as base station or SAN/data-center to central location with a redundant path. OTDR at 1470 nm is used on the fiber pair to test the metro-loop live fibers. One of the two metro fibers would continue and test the access cable integrity using a dark fiber.
When Is Bidirectional Monitoring on the Same Fiber Required?
In the context of establishing fiber surveillance on live CWDM links, one may ask: Should I monitor those links both directions? With the CWDM optical link budget in the 28 to 30 dB range, minus the CWDM filter insertion loss (estimated 5 dB total) and a 3 dB margin, CWDM communication can be established on fibers with up to 20 to 22 dB fiber attenuation at the most. For these levels of fiber attenuation, the ability to detect and locate a large and/or reflective degradation can be precise and easily done with a single-ended, unidirectional OTDR test. The following are cases where it is suggested to establish bidirectional testing:
Monitor with higher resolution—using a 10 μs pulse width, as per the above results, leads to inherent difficulty in locating a degradation with high accuracy. Testing with 1 or 2.5 μs pulse width increases this accuracy but reduces the measurement range that can be achieved;
If the link is not spliced and reflections exist, the reflecting events measured on the OTDR may hide events that are further down the fiber in the event of attenuation dead-zone. Testing from the opposite side can provide more details about the actual nature and more accurate position of the degradation in this case;
The optical network is designed to scale-up using DWDM channels on the 1530 and 1550 nm CWDM channels; this could hike-up the TX power in the fiber due to Raman spontaneous emission scattering (if the measurements get impaired by this undesirable noise, then testing from both sides may become a necessity for adequate coverage);
No point of failure is required for monitoring—if the fiber has to be monitored on 100% availability, then testing from both sides becomes a must.
An OTDR scan with 2.5 μs pulse width (in black) and 10 μs pulse width (in red) both with 15 second acquisition time
Figure 5. An OTDR scan with 2.5 μs pulse width (in black) and 10 μs pulse width (in red) both with 15 second acquisition time. With 2.5 μs pulse width, 1 to 2 dB degradation in the last section of the fiber would barely be detected, especially if it is non-reflective (i.e., splice degradation or bend). It may then be required to test from both sides of the fiber, as proposed at two different CWDM wavelengths.
Monitoring with High- or Low-Resolution OTDR Measurement
As indicated above, the ability to precisely locate a fiber fault depends on the test parameters used, mainly OTDR pulse width and averaging time, but also where the event or the attenuation level from the injection point, as well as the nature of the degradation, are located. In some very long links, if the degradation occurs at the far end of the link, it becomes useless to try to test with a shorter pulse width, as averaging up to three minutes time will typically increase measurement range by for 1 to 2 dB only. Then one has no other choice than to test with a longer pulse width. In this case, it is important to remember that the event positioning accuracy is degraded compared to smaller pulse width (e.g., 1 μs or 2.5 μs). In the case of a reflective event, as illustrated below, testing with multiple pulse widths, leads to a noticeable difference in the positioning accuracy:
Testing with multiple pulse widths leads to a noticeable difference in the positioning accuracyMeasured drift of a 2 dB connector reflective event position according to pulse width used to characterize it
Figure 6. A connector with 2 dB degradation (typically should be 0.2 to 0.5 dB) tested with various OTDR pulse widths. Inherently, the analysis for positioning the event cannot be made with the same accuracy.